Modibodi x Contentsquare
This 5-minute filter optimization update earned Modibodi an additional $10K a month
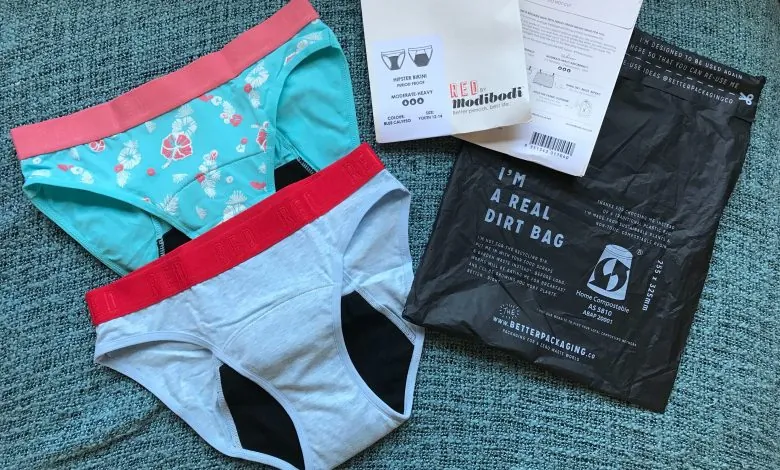
The Company
Modibodi is a leader in sustainable and reusable absorbent apparel and offers their products to consumers around the world through their ecommerce store. With a wide range of styles, fit and colours available, it is crucial that consumers have access to relevant filters in order to deliver a great shopping experience.

The Insight
After launching their ‘All Gender Collection’, the Modibodi team worked with Contentsquare to run a performance analysis and uncovered some actionable insights on their product listing page filters within just 1 week.
Observation #3: The ‘Type’ filter option performs quite well with shoppers, with a 5.25% conversion rate per tap. Even so, it was still engaged with less than half as often as the “Size” filter.
Observation #4: The ‘Absorbancy’ filter is engaged with as often as the “Type” filter, but did not promote conversions.
Observation #1: Amongst all the options, their best-converting filter is ‘Sort’, with a conversion rate per tap of 16.7%. However, only a very small group of users were engaging with it.
Observation #2: The filter with the highest engagement is ‘Size’, but sits quite low down as the fourth option, meaning it is not seen by visitors as easily or as often.
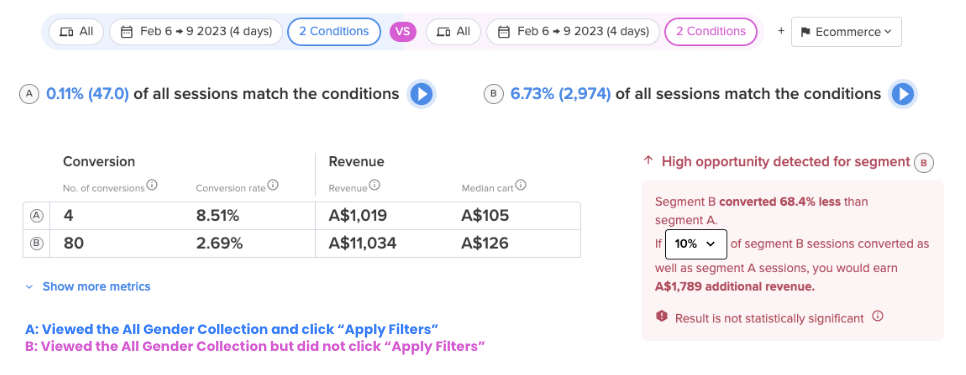
Using Impact Quantifcation, the Contentsquare team was able to show Modibodi that more shoppers were converting if they had applied filters. If 10% more shoppers applied filters, it could earn Modibodi an additional $13.6K in monthly revenue.
Recommendations
- Consider re-ordering the filter options according to their engagement and conversion power. The “Size” filter in particular, due to its high engagement and conversion power, despite its lower exposure in the list.

The Results
Since raising the ‘Size’ filter higher up the list, it has generated 122% more revenue per click. In addition, the revenue per click for the “Apply Filters” call-to-action has more than doubled from $5.80 per click to $11.90 per click.
In fact, increasing the exposure of the “Size” filter not only increased engagement for the “All Gender Collection” listing page, but also increased CR and revenue through all PLPs and all filters by 23% on mobile and led to an increase in revenue of 5% on desktop.
The Results
The Final Numbers
With the help of Contentsquare, Modibodi was able to surface these insights and implement these seemingly insignificant changes to secure an additional $4.4k on mobile, and an additional $5.4k on desktop monthly.
-
![]()
Case Study
How Calzedonia saved $20K per year by removing under-performing content from the homepage
Read more about the team at Calzedonia used Contentsquare's behavioral analytics to work more efficiently and save $20k a year in maintenance in costs.
-
![User segment zone tracking metrics]()
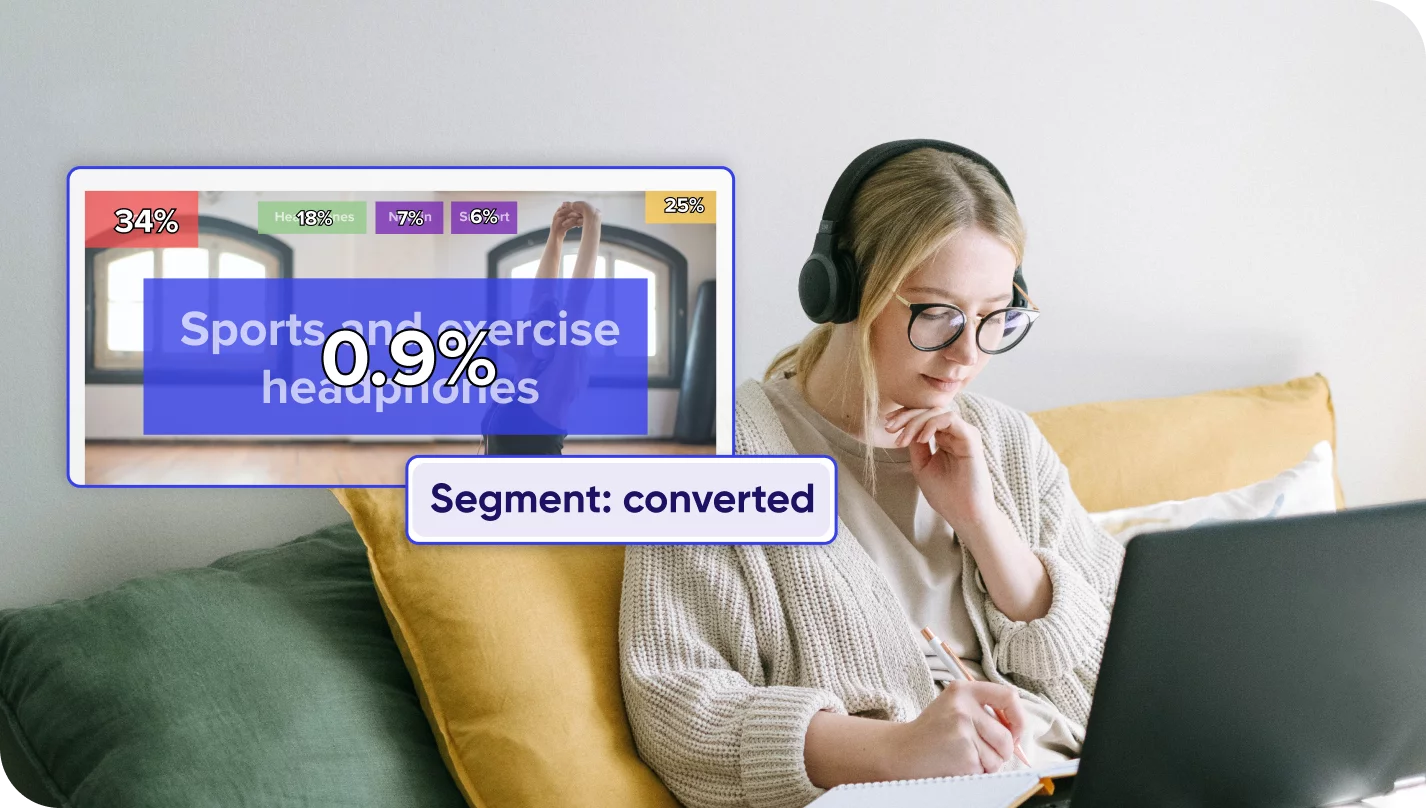
Capablities
Zone-Based Heatmaps
Reveal how users interact with each element on your website; understand what makes them click, what elements attract their attention, and what content makes them bounce. Go beyond basic analytics metrics to understand why your users behave as they do online.
-
![]()
Blog
How execs use digital experience analytics (DXA) to optimize and maximize technology investments
Last year, rapid digital maturity saved and enhanced many previously digitally immature businesses. Read about how taking the right actions on digital experience transformation can help in shaping the success of businesses this year and next.